We use cookies to make your experience better. To comply with the new e-Privacy directive, we need to ask for your consent to set the cookies. Learn more.
Proteus Integration with Home Assistant
Introduction
This document refers to setting up Proteus sensor system to work with Home Assistant (HA) using local network. HA offers endless possibilities of interconnecting sensors and devices to act in coordination. We will cover the process of setting a static IP for your sensor, adding a webhook end point, tie the webhook trigger to filter request using the serial number, and turn a light on or off based on the alarm condition. You can expand on this to add more conditions or change the actions based on your requirements.
Important Notes
- This document is not a tutorial for Home Assistant Setup. Rather, it is intended to help add Proteus sensors to an existing HA installation.
- Proteus Integration with HA can be done in 2 ways.
- REST API Method: In this method, we will add the sensors to configuration.yaml. HA will poll the sensor at regular intervals to get a json formatted data packet, parse the packet and set the state of the sensor based on specific tags. We can add Proteus
- Either as a 'binary sensor' which is ideal for switch type sensors, ie sensors that have either an on or off state. Examples include Proteus water sensor, level sensor, door sensor, etc.
- Or as a ‘sensor’ so that you can specify the data tags and show data on the HA dashboard. Example would be Proteus temperature sensor which is not an on/ off type sensor.
- Webhook Method: In this method, we will stop using Proteus cloud and configure its cloud system to point to the HA server. To handle the requests from the sensor, we will add a webhook automation entry in automation.yaml. The advantage is that any alarm condition can be immediately alerted to HA instead of having to wait for HA to poll the sensor.
- REST API Method: In this method, we will add the sensors to configuration.yaml. HA will poll the sensor at regular intervals to get a json formatted data packet, parse the packet and set the state of the sensor based on specific tags. We can add Proteus
Notes: Proteus Sensors is not affiliated or associated with Home Assistant or any other 3rd party services mentioned in this document.
Let’s get started!
Setting up a static IP for your sensor.
In order to make sure the sensor is accessible at the same IP as time passes, it is a good idea to set a static IP to your sensor. This can be done very easily. You can find the current IP of your sensor from your router. Go to that IP address via a web browser on a computer or phone which is connected to the same wifi network as the sensor. This will get you to the home page of the sensor. From the top navigation bar, click on Network tab. On the Network tab, uncheck the “Enable DHCP” checkbox. This will give you options to set your static network parameters. Make the necessary changes and save the settings. Repower your sensor once for the changes to take effect right away. To make sure the sensor is connecting to the network with the IP that you assigned, you can try access the sensor using the static IP. If the setup went correctly, you should be able to see the home page of the sensor at the static IP.
Add a sensor entry to configurations.yaml in HA.
To add Proteus to the HA dashboard, you can use the REST method. Add the following section to your configurations.yaml. This method makes a poll request to status.json end point on the sensor to retrieve the sensor data. The flood sensor json data is used to determine if the sensor is detecting water or if it is dry.
To add as a sensor, an example is shown below.
sensor:
- platform: rest
name: Proteus Water Sensor
resource: http://192.168.0.28/status.json
scan_interval: 60
value_template: >-
{% if (value_json.fld== 1) %}
Dry
{% else %}
WET
{% endif %}
To add as a binary sensor, an example is shown below.
binary_sensor:
- platform: rest
resource: http://192.168.0.28/status.json
method: GET
name: Binary Water Sensor
device_class: moisture
scan_interval: 60
value_template: >-
{% if (value_json.fld== 1) %}
off
{% else %}
on
{% endif %}
Make sure you change the IP address to that of your sensor in the ‘resource’ line above. After you make this change, save the file and restart HA for the new configuration to take effect. You should be able to see the sensor listed on your dashboard.
Add a webhook automation entry to automations.yaml in HA.
While the REST method can handle most of the sensor features, Proteus can be programmed to trigger a webhook call when the sensor detects an alarm condition or if it goes from alarm to reset. This way, HA gets to know of the event right away rather than wait until the next poll cycle to update. In order to do this, first we create an automation in HA with webhook method. In this example, we will use this webhook to turn a light on or off based on the alarm condition of the sensor.
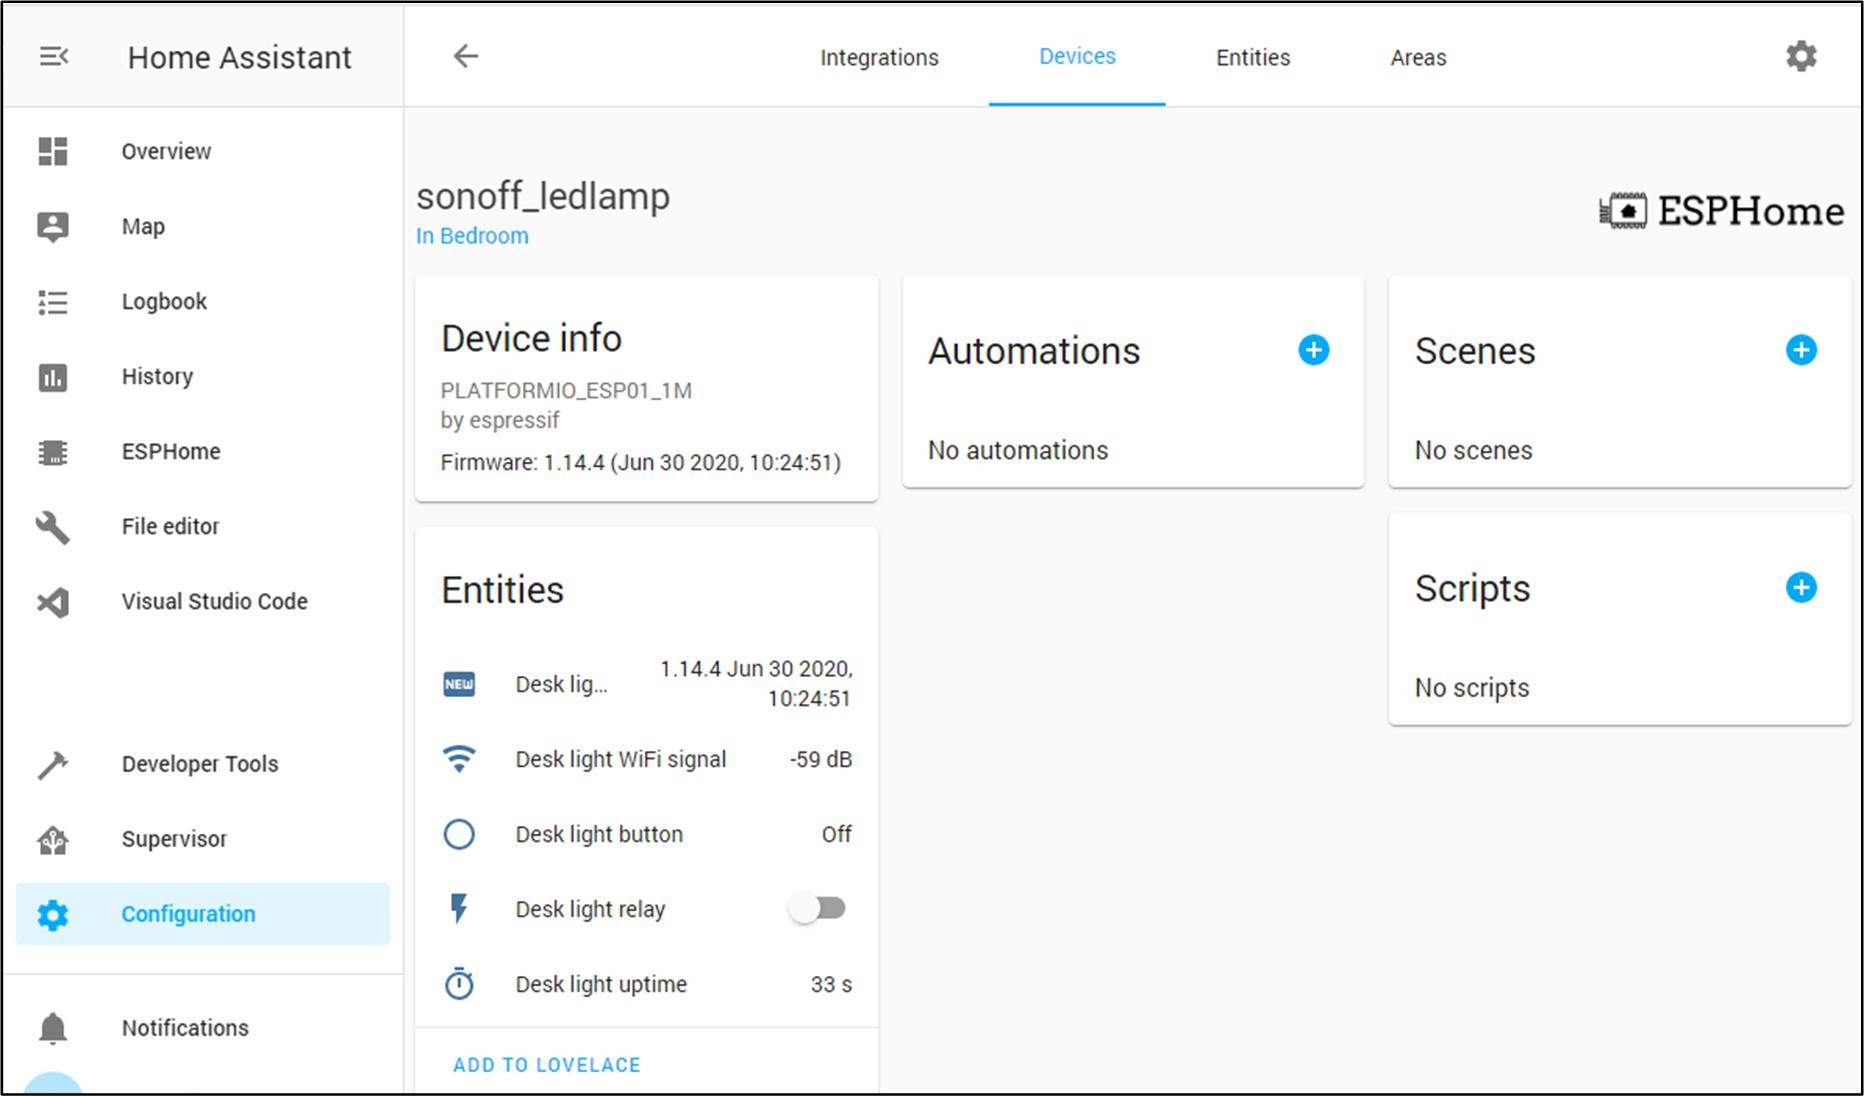
The safest way to set a webhook is to go to any of the currently existing devices and create an automation, and modify this automation to match our needs.
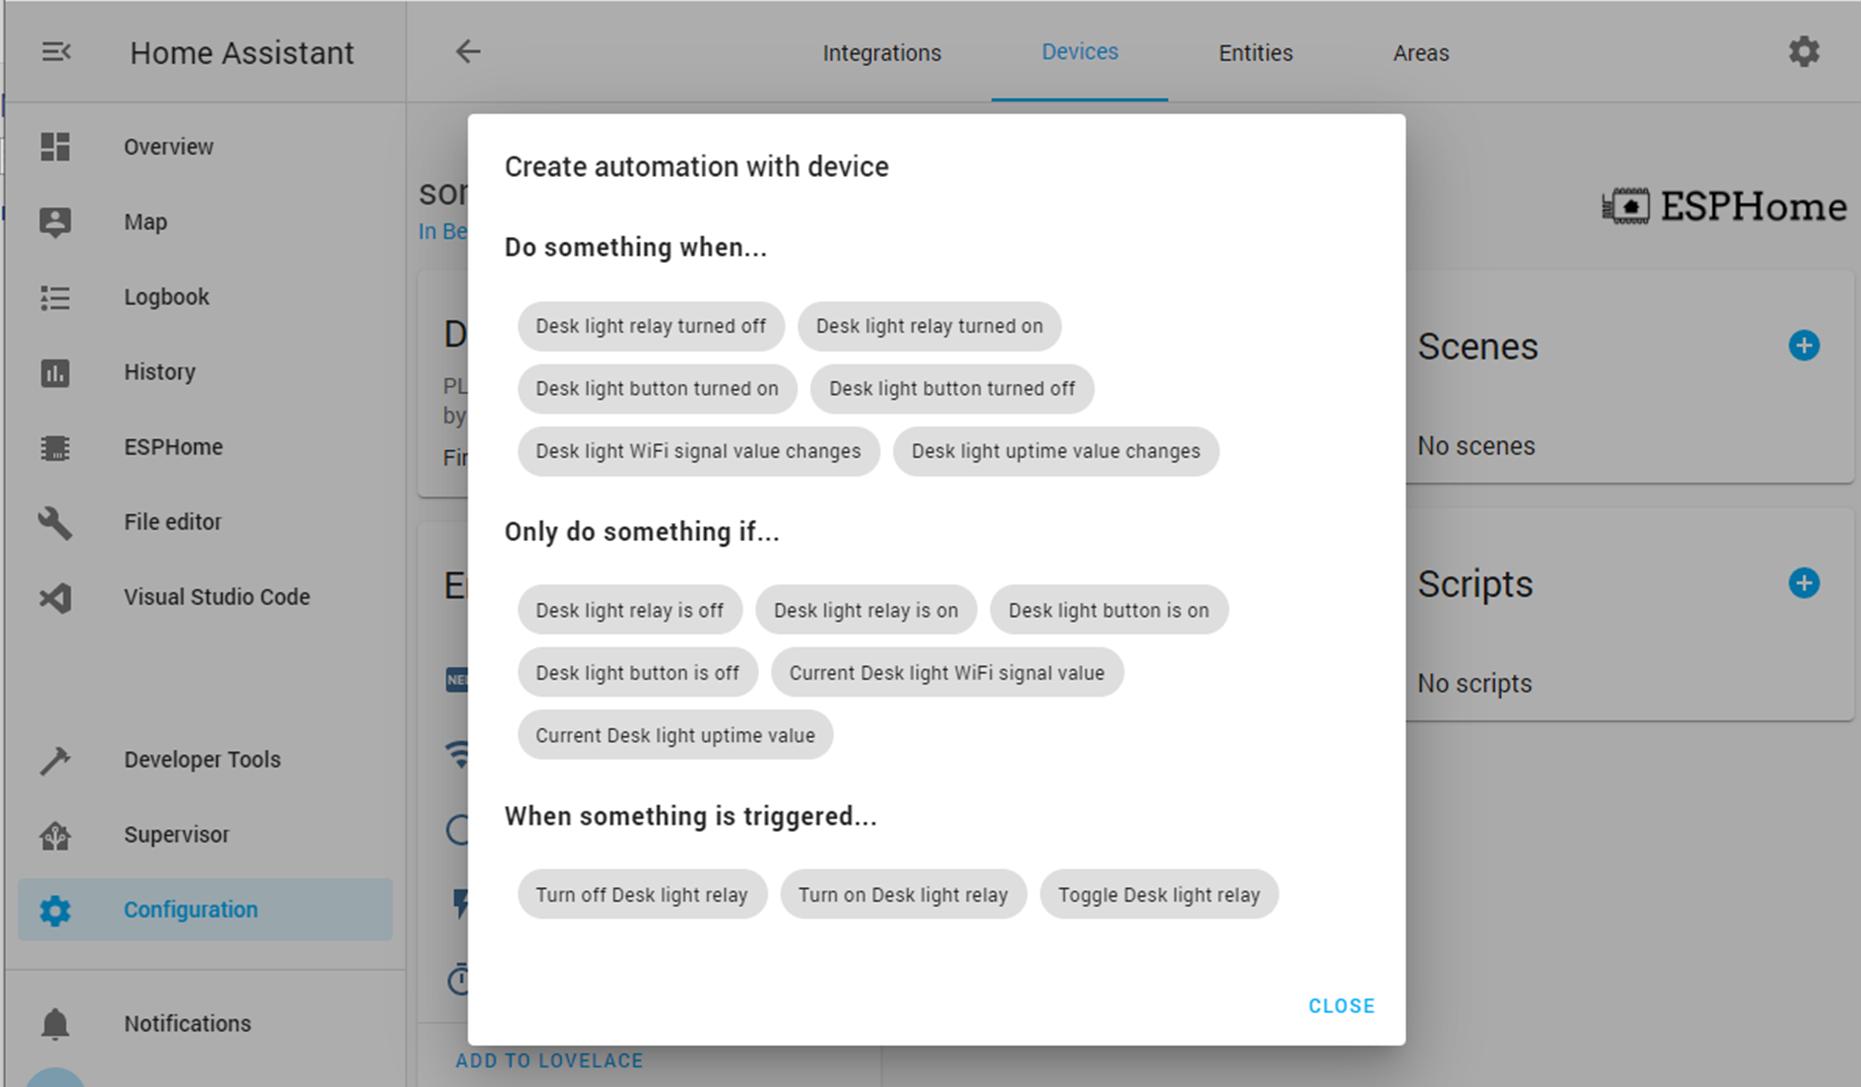
Here we have a sonoff based lamp switch as shown. It has a relay switch that can be turned on or off. Go to Configurations > Devices and Select the relay switch we want to control.
Click the + button in the Automation section to add a new automation. Select Any one of the bottom options as we are going to edit it later anyways.
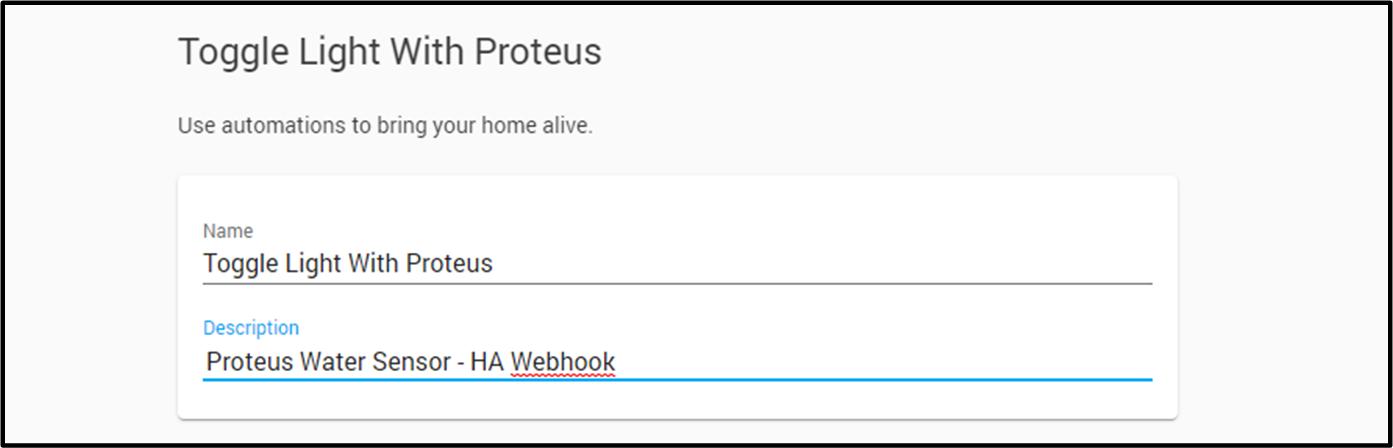
Give a suitable name to this automation.
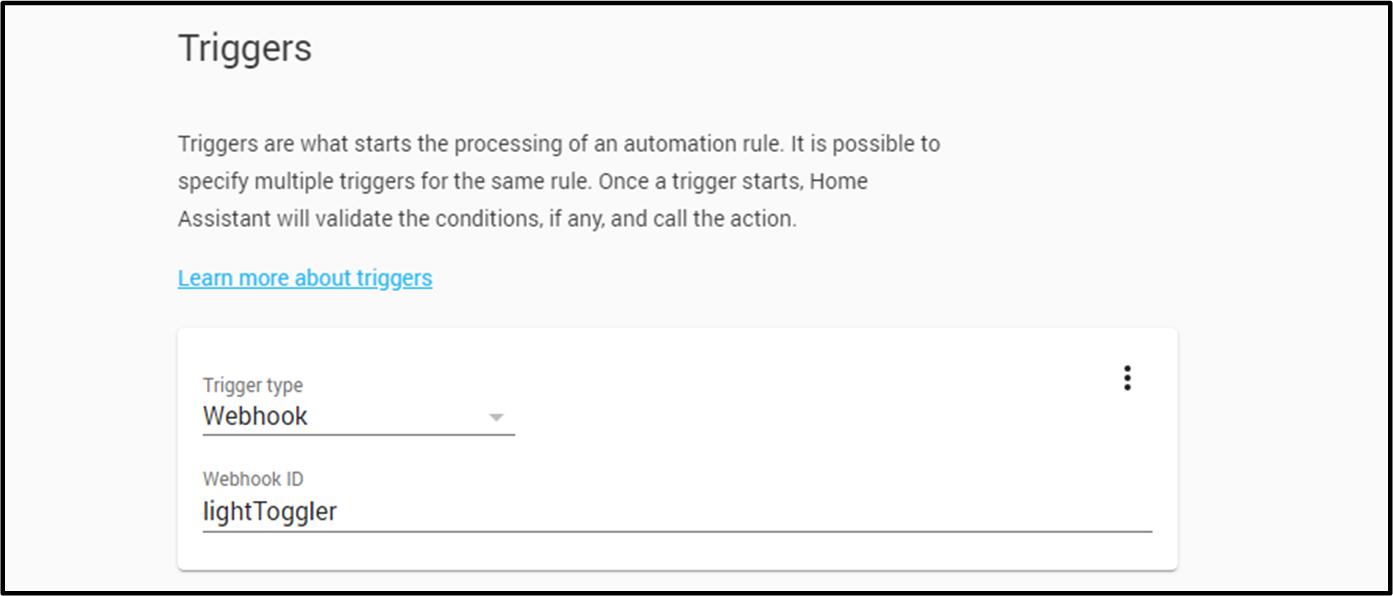
Select webhook as the trigger.
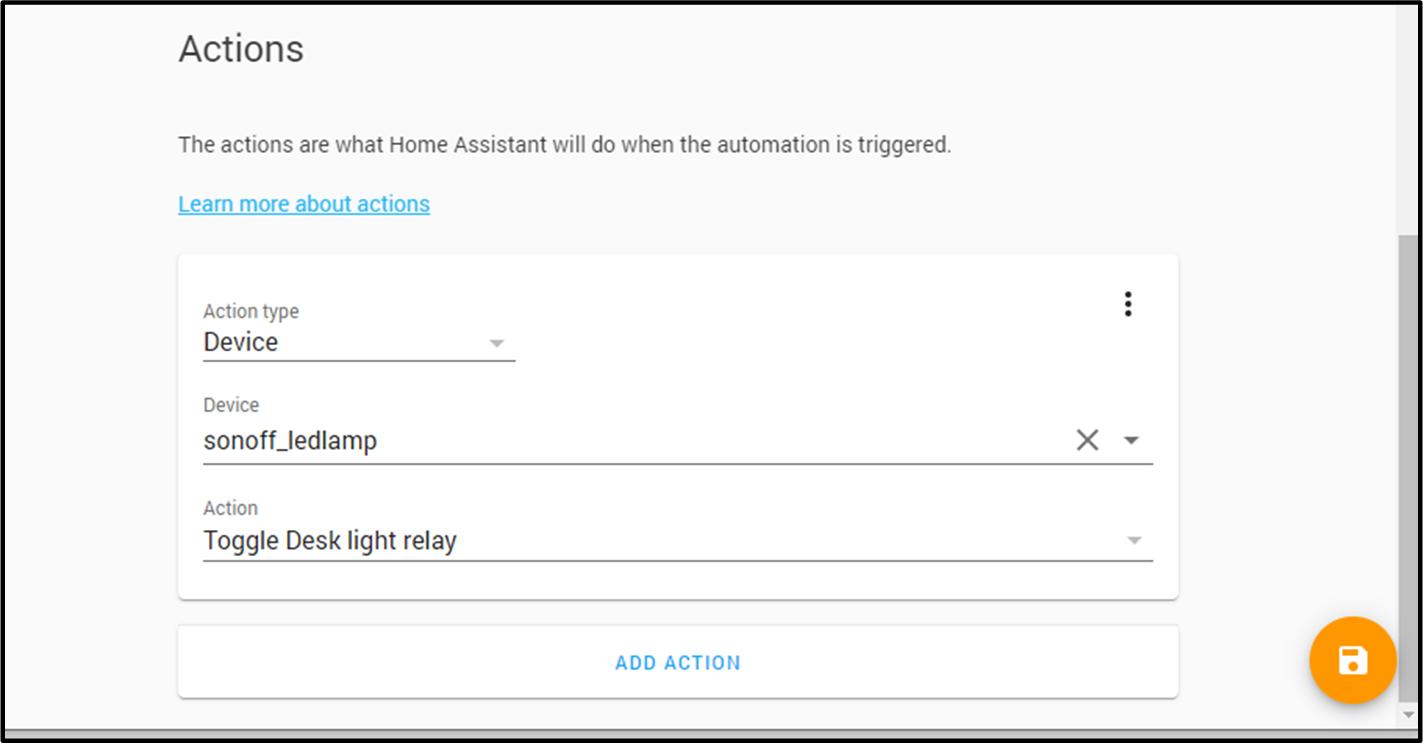
We will set conditions based on the post data coming from Proteus. So, for now you can ignore the conditions. In the actions section, select device as action type, select sonoff lamp as the device and select toggle option as the action. Offcourse, in your case, you can select which ever actions best suits your application. Click the save button at the botton corner.
This will give you a yaml entry in automations.yaml in your home assistant. Open automations.yaml and locate this entry.
First, We will edit the condition so that this webhook will trigger an action only when the serial number of the sensor matches the that of Proteus. This way, if you have multiple sensors, you can create multiple automations and filter them based on the origin of the webhook requests. Add the following in place of condition. Remember to change the serial number to match that of your sensor.
condition:
- condition: template
value_template: '{{ trigger.json.sid0 == "2571430" }}'
Now, we will add the action. Even though we selected toggle light as the option, it makes more sense to turn light on if water is detected, and turn light off if sensor detects a dry condition. Proteus post data includes a tag called “alm”. We will use this tag to determine if the sensor is in alarm condition or not.
Note: alm=1 does not necesarrily mean there is water. It means that the sensor is in Alarm. If you configure water sensor to be normally dry and to alarm when it detects water, alm=1 means Proteus detected water. On the other hand, if you configure the sensor to be normally wet (sensor is dipped in water) and to alarm if water goes dry, then alm=1 means sensor is detecting dry. On our case, we will set the sensor to be normally dry, so alm= 1 means water was detected.
Add the following section to the action.
action:
- service_template: >-
{% if (trigger.json.alm == 1) %}
switch.turn_on
{% else %}
switch.turn_off
{% endif %}
entity_id: switch.desk_light_relay
In addition to this, we can also force update the Proteus Sensor entry on HA so that does not have to wait for the next poll cycle to know that water has been detected. To do this, we will use the update_entity method. Add the following code below the action.
- service: homeassistant.update_entity
data:
entity_id:
- sensor.proteus_water_sensor
Altogether, the automation code corresponding to the webhook will look as follows.
- id: '1593619027730'
alias: Toggle Light With Proteus
description: Proteus Water Sensor - HA Webhook
trigger:
- platform: webhook
webhook_id: 'lightToggler'
condition:
- condition: template
value_template: '{{ trigger.json.sid0 == "2571430" }}'
action:
- service_template: >-
{% if (trigger.json.alm == 1) %}
switch.turn_on
{% else %}
switch.turn_off
{% endif %}
entity_id: switch.desk_light_relay
- service: homeassistant.update_entity
data:
entity_id:
- sensor.proteus_water_sensor
Reload automation
After saving the automation yaml code, Go to Configuration > Server Controls and check if the configuration is valid. Yaml can be tricky and errors can creep in including having wrong indents. Once the configuration looks valid, click "Reload Automation" for the changes to take effect.
Configuring Proteus.
So far, we have been configuring HA. It is time to update the webhook settings on Proteus so that they are invoked correctly during alarm and alarm reset events.
Note: As mentioned in the beginning, HA support within Proteus uses the custom cloud push feature. This means that you will be using the sensor locally and not with the proteus cloud. You won’t be able to see live data on our cloud, nor make changes to settings from our cloud. The good news is that HA can be configured to view remotely using dynamic DNS settings and port forwarding. For making changes on settings, you will need to directly access the sensor settings tab.
Let’s setup the webhooks on Proteus.
First, access the sensor web interface on a laptop. To do this, you must
- connect your laptop to the same wifi network as the sensor is connected to .
- Then open a web browser and type in the IP address of the sensor in the address bar.
- Once you are on the sensor web interface, click on the cloud tab from the navigation bar. This page should give you option to push data to your own cloud (in this case, we will configure it to push data to HA, with the webhook endpoint).
- If you don’t see option on the cloud page, you can enable it by issuing the following command after the IP address. So if your sensor has an IP of 192.168.1.112, You can type the following in your browser.
192.168.1.112/index.htm?eEONPRO=1
You will get some json response on this page. You can ignore this, and go back to the cloud page (192.168.1.112/cloud.htm). Now you should be able to see the advanced options.
- Setup the server configuration based on the HA server IP address, port number, webhook end point etc that we setup earlier.
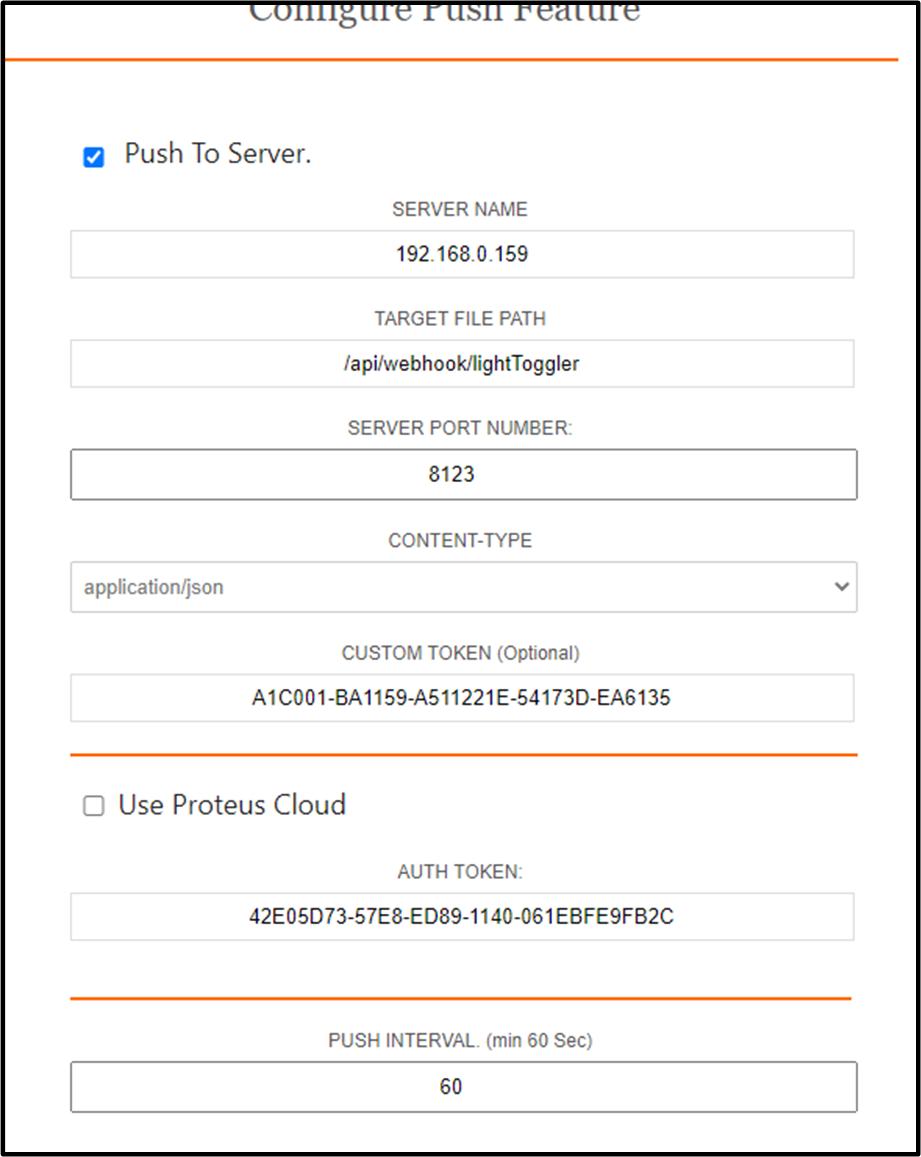
- Save Settings.
This completes the setup. At this point, Proteus is configured to push data to HA every 60 seconds (configurable on the cloud page). IT will also push alarm and alarm reset events immediately to HA. Based on the automation configuration, you should the light switching when alarm trips or resets.
Testing
HA setup and configuration can be daunting. During the setup and troubleshooting, an easy way to replicate the sensor is to use the Advanced Rest Client Extension for Chrome and use the following setup to test whether HA setup is working correctly. Once all is working as expected, you can move on to the water sensor to do some real tests.
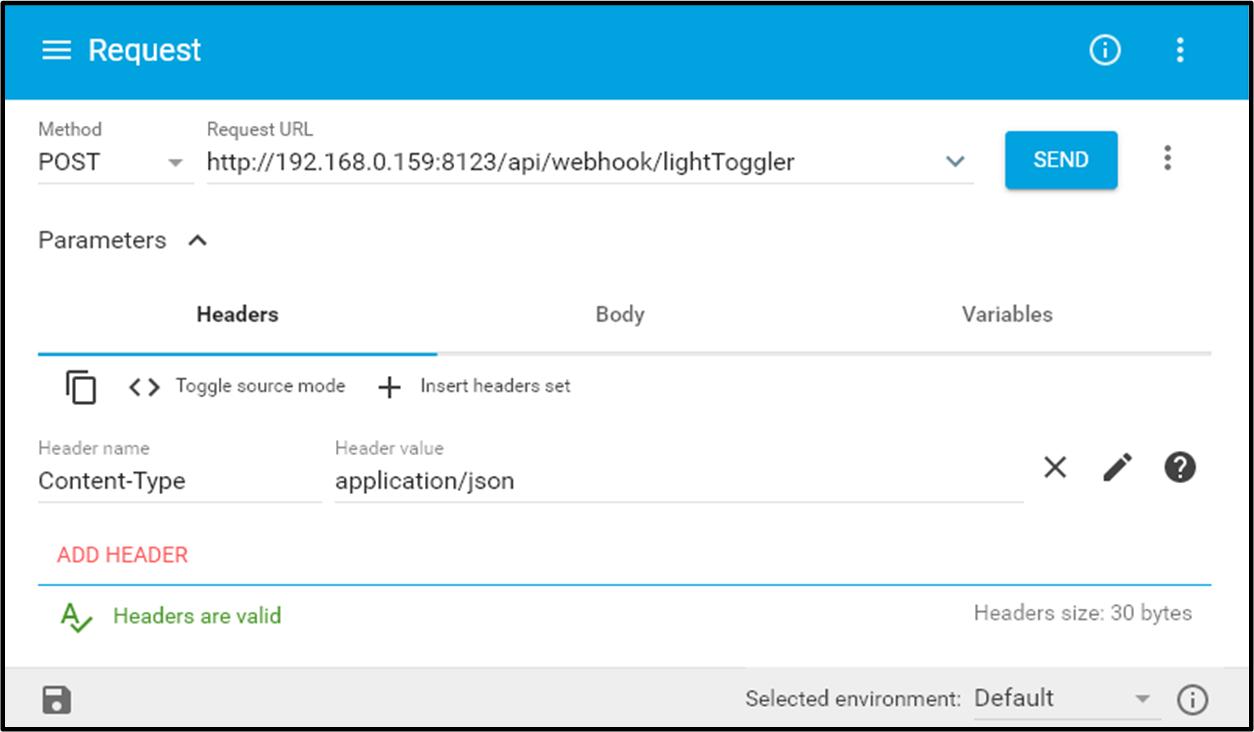
- Install Advanced Rest Client Extension, and open the extension.
- Set POST for Method.
- Set the webhook api endpoint for Request URL
- Click on Headers, Select Content-Type and set application/json.
- Click on Body, and add the following json . Serial number, and alm tag is sufficient for this test. Update this with the serial number for your sensor.
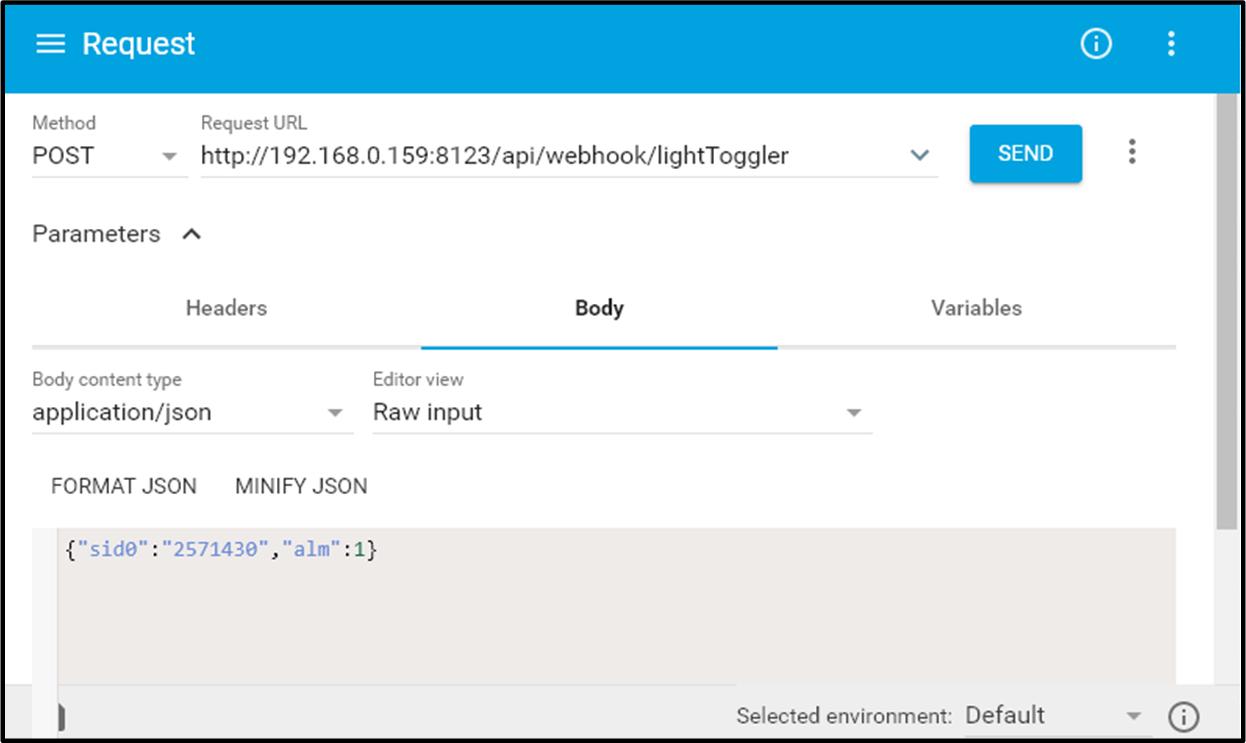
- Click Send. You will see the HA dashboard changing status of switch from off to on.
- To test an alarm reset, you can change the alm tag to 0 and click send.
Questions?
Got a question? Contact us at support@proteussensor.com with your queries and we will get you the information you need right away.